
Boom and crash index
- we gonna be covering 4 index
- crash 100 index
- boom 100 index
- crash 500 index
- boom 500 index
The strategy
- crash and boom are found under binary .com broker
- Set the following indicators to trade crash and BOOM
- WE ALWAYS USE 1HOUR CHART TO ANALYSE WITH THIS INDEXES
- SET RSI WITH PERIOD1 , LEVELS 9,10,11 AND 89, 90,91,92
- THE MACD WITH FAST EMA 12 , SLOW EMA 26, MACD SMA 9
- THEN SET MOVING AVERAGE 5 EXPONENTIAL
- On the main chart set bollinger bands with period 34 deviation 1.619
- As always we cannot trade without checking the behaviour of the market
- We all know that I love m and w
- So they still part of this strategy , but there is more to it
For buy setup
- Wait for moving average and macd to be OVERSOLD
- Wait for the market on any bom or any crash to reject outside the Bollinger bands
- Then wait for the moving average to start making a v
- Once the moving average start to make a v check the market
- On the market wait for a v or a w setup with rejections
- On the v or w setup wait for the market to push up with atleast 1 candle candles from there take a buy
- With this indexes we always hold because once they go up , they will go up until they show you a reversal sign
- Again you can also take trades based on double bottom or w formation
- With this simple strategy , you will always make cash
- Boom and crash are very simple on 1 hour chart
- They reverse with a w or a v
- As long as there is rejection outside the Bollinger bands there is a reversal
- We use only 1 hour chart it’s the best for those indexes
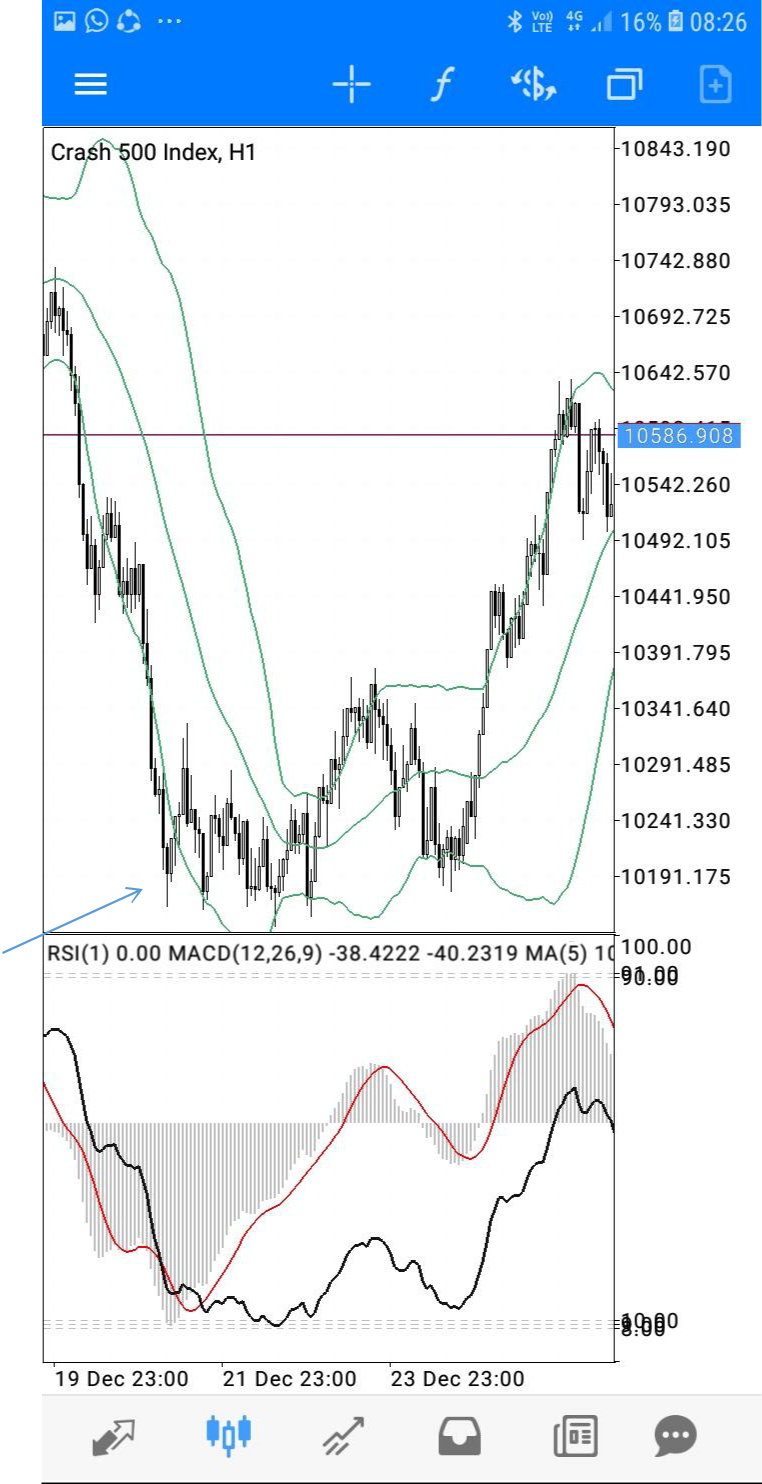
Examples
- The below screenshots shows you perfect entries for boom and crash
- Entry is shown with an arrow
- Macd and moving average 5 are clearly seen oversold
- Rejection outside Bollinger is also shown
- Remember always 1 hour chart


Wait for moving average and macd to be OVERBOUGHT
Wait for the market on any boom or any crash to reject outside the Bollinger bands
Then wait for the moving average to start making inverse v
Once the moving average start to make inverse v check the market
On the market wait for a v or setup with rejections
On the v or m setup wait for the market to push down with at least 1 candle candle from there take a sell
With this indexes we always hold because once they go down , they will go sown until they show you a reversal sign
With this simple strategy , you will always make cash
Boom and crash are very simple on 1 hour chart
They reverse with a m or inverse v
As long as there is rejection outside the Bollinger bands there is a reversal
We use only 1 hour chart it’s the best for those indexes
