Trade Synthetic Indices with Precision and Strategy
Overview of Indices
We specialize in four primary Volatility Indices. These are synthetic markets that move 24/7, independent of traditional currency news and geopolitical events:
VIX 75 (High Profit/Leading)
VIX 50
VIX 25
VIX 100
Pro Tip: VIX 75 is the most volatile and profitable, followed by 50, 25, and 100. Our specialized strategy applies seamlessly to all four.
Start Trading Synthetics Today
Minimum Deposit: $10 | Minimum Lot Size: 0.01
All Volatility Indices are found exclusively on the MT5 Synthetic Account.
*Instant deposits and withdrawals for VIX 75 traders via our partner broker.
The Core Strategy
Volatility Index trading is highly effective when you understand its specific rhythm. Unlike the Forex market, VIX often manipulates standard retail patterns like basic support/resistance, flags, or wedges. To be profitable, you must move beyond basic Forex knowledge.
Example 1: The M-Formation setup on a higher timeframe.
Our Execution Tools:
"M" and "W" Formations
Clear Candlestick Rejections
Higher Highs & Lower Lows
Escalpando Indicator (Scalp Reversals)
V-Formations (Inline with Trend)
Optimal Timeframes:
Daily Chart: Overall Trend Analysis
4-Hour Chart: Pattern Confirmation
15-Minute Chart: Precision Execution
Swing Trading Strategy (Sell Setup)
For long-term swing trades (holding for 3 to 5 days), we follow a strict multi-timeframe sequence to ensure the highest probability of success:
Daily Analysis: Locate the Daily peak. We wait for the Escalpando Indicator to show Overbought conditions.
Pattern Identification: Look for an "M" or "Inverted V" formation. There must be sharp rejection wicks on the peaks.
H4 Confirmation: Drop to the 4-Hour chart to verify that the bearish structure is holding.
M15 Execution: Switch to the 15-Minute chart. Wait for a final upward rejection wick, then enter your SELL.
Holding: VIX moves in aggressive straight lines. Scale into the position as long as red candles dominate. Hold until the market reaches the Daily oversold zone.
Example 2: A W-Formation indicating a reversal from the bottom.
Trading the "M" Formation
When the Daily or 4H chart is overbought, look for a "Naked Peak"—this occurs when no previous candles are visible above the current price level.
The "M" must show clear wicks (rejections) on both legs.
Once the second leg confirms on the H4 timeframe, zoom into the 15-minute chart for entry.
Enter after a rejection wick and target a 3-5 day hold for maximum pips.
CHART EXAMPLES: M-FORMATIONS
Trading the Inverted V-Formation
This is an aggressive reversal setup used when the market becomes parabolic and overextended:
Example 3: Inverted V-Formation showing a sharp rejection peak.
Wait for a sharp peak where no candles exist above the current price.
Identify the "Long Wick" rejection candle.
Enter SELL as soon as the following candle confirms red momentum.
Pro Exit Strategy: Hold the trade on the 15-minute timeframe until a clear bullish Buy setup (W-Formation) appears at the bottom.
Strategic Summary Checklist:
Always confirm the trend direction on the Daily/H4 charts first.
Look for clean structural peaks (M or Inverted V).
Verify that clear rejection wicks are present.
Use the 15-Minute chart to time your entry for the tightest stop loss.
Hold your runners until an opposing pattern (W-Formation) forms.
Disclaimer: Trading synthetic indices involves significant risk of capital loss. Ensure you master the strategy on a demo account before trading live funds.
Hello, Greetings From Premium Trading !! To Get The Best Benefits From The Pt Pro Indicator You Must Have To Follow The Instructions !!
make A Good Deposit
be Patience
be Organized
make A Plan
set Your Daily Goal
set Your Trading Volume Per Trade
set Your Trading Limit
learn When To Stop
follow Proper Money Management
STICK TO THE PLAN AND YOU WILL SURELY BE IN PROFIT.
SOME FACTS ABOUT THE INDICATOR :
Firstly The Signals From The Indicator Is Smooth Or You Can Say Frequent So Do Not Ever Just Rush On Trades. Remember The Opportunity Will Always Come. If You Miss A Trade Leave It. Do Not Trade The Whole Day, Because There Is No Such Indicator Which Will Give You Signals The Whole Day Perfectly As The Market Changes Its Patterns Every 10 Minutes So It’s A Real Fact And You Have To Accept It. You Just Need To Be At The Right Place At The Right Time That’s The Key Of Success. Never Trade Big Amount On A Single Trade, Because There Is Always Some Broker Influences, So If You Trade Big Amount And You Are At A Bad Time You Could Be Losing On A Good Signal So We Highly Recommend To Go Slow With Amount And Make Continuous Profits. So Keep These Factors In Mind And Achieve The Success In A Professional Way. Financial Market Is A Professional Job So Act Like One.
OUR RECOMMENDATIONS :
Making Profit From A Financial Market Is All About Mastering A System. So To Become A Master In Taking Signals On This Indicator It Requires At Least One Week Demo With The Indicator. Trade One Week In Demo Account With The Indicator Then You Go For Real Trading To Get Perfectly Synchronised With It !!
WE RECOMMEND YOU TO MAKE YOUR EXPERIMENTS AND USE IT IN A WAY WHICH SUITS YOU.
WHEN TO TRADE/ NOT TRADE :
Trade When Market Has A Good Volatility Do Not Trade When Market Is Moving Sidewise Watch The Support/resistance Line To Get Clear Idea Of Assuming Where Market Could Move If You Are Late Ignore That Signal Take Re-entries With Your Previous Experience And Knowledge But If You Are Not Confident Enough Do Not Take Re-entry Gmt 3 am ++ Is A Good Timing For The Signals From Indicator ( Try Finding Your Suitable Timing By Practicing) You Can Simply Discover The Best Way To Make Best Use Of The Indicator By Practicing Regularly The Signals Are 0 Candle Signals, That Means It Comes Immediately, So Take The Entry Asap !!
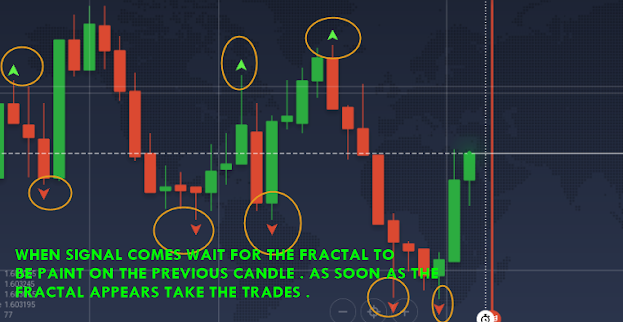
Technique Fractal :
An open fractal in IQ OPTION. Fractal value (5). When the signal appears you wait for the fractal to be painted. When the fractal painted on the previous candle you take the trades in that pair. Please see the photo below as an example.
3 MIN EXPIRY TECHNIQUE :
TRY 1 MIN SIGNALS AND 3 MIN EXPIRY IN IQ. VERY EFFECTIVE
ADX TECHNIQUE:ADD adx in Iq. When signals come please wait till the adx crosses each other. When it happens take trades in IQ for 2-3 min expiry.
Binary.com may be a UK-based binary trading broker. it's been licensed by and is under the regulation of British Isles, Malta, Ireland and therefore the UK. it's one among the foremost transparent binary options brokers UK. it's made declarations of owning the corporate, and it's responsible for the market operations. The platform brings together aspects of gambling and binary trading. Its services include FX margins, Crypto trading via MT5 and CFDs. Binary.com offers you over 100 instruments to trade with. Binary.com also offers you interactive webinars, daily market reports and eBooks and videos for learning, all for free of charge.
Trading Platform
Binary.com operates an internet site and Android and iPhone Apps. you'll log in to your account on any platform of your choice. The platform also offers you the choice to trade on a virtual account before you progress to a true account. Newbies to binary trading can cash in of the virtual platform and learn the ropes. The platforms run 24/7 all year long. they need interactive and straightforward to know charts to assist you to follow the market trends. The platforms are quite responsive too.
The minimum deposit for a bank transfer or by credit card is $10. Those with e-wallets can deposit as little as $5. you begin trading by choosing an instrument to trade with and setting aside a trading duration. you've got to possess to finish the trade before the expiry time.
The return percentages aren't fixed. They vary from time to time. you would like to possess quite 25 turnovers in order that you'll have a withdrawable amount. Binary.com also pays a 1.5% payout commission.
The bonuses aren't fixed either. you'll get two sorts of bonuses. there's the deposit bonus and therefore the free bonus. You get the deposit bonus once you deposit money above a particular amount. The free bonus is given as per the results of your trades.
Forex trading deals with buying and selling of currencies with the aim of creating profits.
Foreign Exchange Market is the largest trading market and has a mean turnover of US$5 trillion on a day to day round the world.
This is larger than all the stock markets within the world combined together. Trading activities are conducted through the “Interbank Market” which allows you to execute trades 24 hours each day, for five days every week from Monday through Friday.
However, forex trading isn't limited to currency pairs alone, there are other aspects just like the synthetic indexes, Personally, I really like trading the indices than the currency pairs.
Personally, I’m forex trader myself and that I can boldly say I make a sizable profit daily from my trading you'll subscribe my youtube channel and watch my strategies on how I made money and my testimonial videos, watch the one below and see how real it gets.
Payment Received
Add caption
The synthetic indexes include assets like Boom, Crash, Volatility, step-index and lot more.
In the remainder of this text, I will be able to explain how you'll trade currency pairs and therefore the synthetic indices
Create A Demo Account
How to trade synthetic indices in forex trading?
Synthetic indices are extremely simple to trade, it's almost like currency pairs, basically, you choose a selected asset and choose the direction of your choice.
You can plan to stay during a trade for as long as you would like provided you've got a robust indication from your technical analysis.
Asset under the synthetic indices includes BOOM 500, BOOM 1000, CRASH 500, CRASH 100, VOLITITY (100, 75. 50, 25, 10) STEP INDEX and lot more.
Each asset has its rate of volatility, for instance, B00M 500 is more volatile than BOOM 1000, and within the same way BOOM 500 gives more profits than BOOM 1000.
Another mistake people make is subscribing to signal groups on WhatsApp or telegram, 99% of such groups are fake, rather than subscribing to signal groups I will be able to advise such individuals to make a demo account and learn forex trading from scratch.
By opt-in certain forex signals, you'll deprive yourself the chance to find out, the training period is extremely important and everybody should embrace it to achieve success at forex trading, within the courses I’m offering, all the voluminous training has been carefully tailored to the important once to urge you getting into the positive direction in no time.
How to synthetic indices forex trading
It’s pretty easy to start out forex trading, all you've got to try to do is understand their basic movements and when to trade them, I will be able to explain more on this within the steps that follow.
This forex trading article is only supported synthetic indices so it'd be a touch different from currency pairs write up.
Step 1. Knowing the traditional direction of movement This is vital if you would like to form profit in forex trading, for instance, the traditional movement of the boom assets (both boom 500 and boom 100) is downward movement, below maybe a picture of its movement.
how to trade boom 500 So it keeps moving down during this form till it reaches a resistance level then there'll be a spike and it jumps up and begin coming down again.
To make money from forex trading within the boom market, you've got to understand the proper entering point and therefore the exit point to not lose your money to a recurring spike.
Unlike the boom market, the crash market’s direction is upward, so it keeps rising till it reaches a price then it dumps, a bit like boom, you would like to understand the proper entering and exit points so you won’t lose your trading capital.
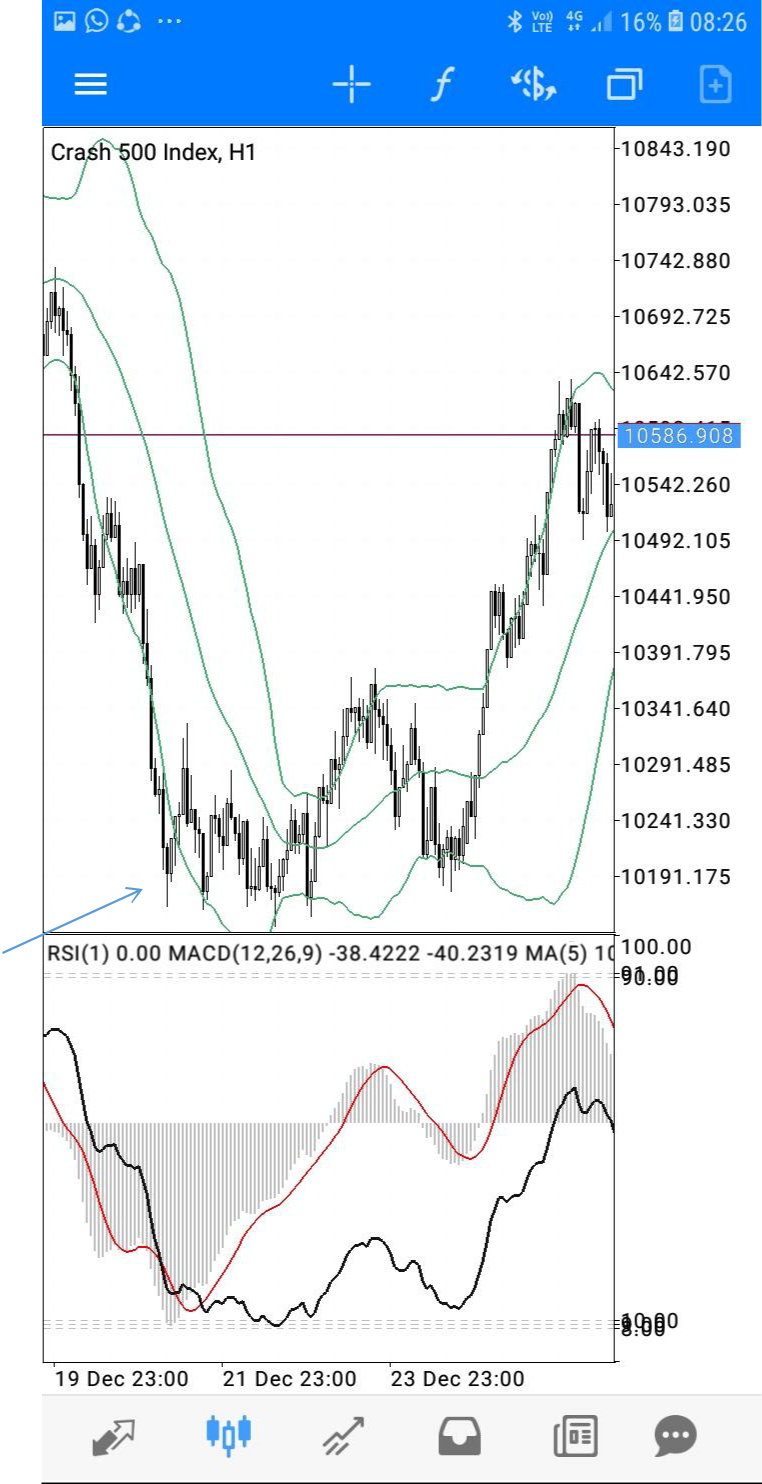
Below is that the screenshot of the movement of the crash market.
how to make money trading boom and crash Step 2. Choosing a broker There are many forex brokers out there including the great and therefore the bad, you want to have best to seek out the great ones you'll trust.
Personally, I exploit www.Binary.com thus far they're awesome, if you don’t like binary option then I will be able to advise you create deep research about any broker you'll wish to use.
Step 3. Analyze the chart before you place your trade In analyzing the market, one must know the entering and exit points in several time-frame like 1 minute, 5 minutes, quarter-hour, half-hour, 1 hour and 4 hours.
If you'll confidently analyze the chart in those respective time frames, then you'll have good confidence to put your trade and milk in the marketplace for long.
There are many videos out there explaining this system but most of them won’t give 100% of it out, unfortunately for you, I'm no different from them.
But excellent news for you is I even have 100% of the winning strategy in my Forex trading courses, attempt to get your hands on anybody of them and observe the amount of cash from forex trading.
Step 4. Make your first trade In making your first trade you would like to make account be it real or demo, choose an asset you would like to trade.
Make proper analysis through the chat using some indicators, many cool indicators will accompany my forex trading package below, so keep reading.
Determine the lots size you would like to use and the way long you would like the trade to last and cast the die.
Forex trading strategies You may have heard that maintaining your discipline may be a key aspect of trading. How does one ensure this discipline while trading?
There are no general strategies that work for everybody, you've got to get what works best for you, within the forex trading courses we are offering will include our greatest trading strategies so you'll practice it and improve thereon.
To create an appropriate strategy, the following things must be carefully considered.
Time: it'll be a nasty idea to undertake and make or reach your daily target from one trade, if forex trading is your part-time hustle then you want to create an honest schedule so you'll have time to trade without affecting your normal source of income.
Daily Target: Most newbies at forex trading lose their money because they don’t have a realistic daily target, I’ve heard of individuals that took their account from $100 to $3,000 and back to $0.00 within 48 hrs. Create achievable targets so you'll achieve them, be realistic with yourself, don’t aim to form millions during a weak, forex trading isn't a get rich quick scheme.
Capital: Another point that's what mentioning is your trading capital, don’t deposit $30 and expect to require it to $1,000 during a day or two, good capital and the achievable daily target is extremely important so you won’t keep losing money once you are alleged to be making money.
Stop Loss: I used to be once a victim of this, know when to simply accept defeat and leave the fight for an additional day, if you made wrong analysis and got trapped during a bad market, it’s better you shut the opposite and accept the tiny loss before it exhausted all of your accounts. It is always important that you simply have the stop loss that you can afford to lose.
Take Profit: this is often vital too as greed has sent numerous individuals back to their village. once you create a trade you ought to skills long you'll stay within the trade from your analysis. If your analysis says you'll stay within the marketplace for 2 mins, then I will be able to advise you allow earlier so a mighty spike or dump don’t teach you a tough lesson. On the opposite hand, if you stay for the two mins and therefore the market remains getting into your predicted direction, I will be able to advise you to go away the market while you'll before your positive gain address negative one.
 raviranjan
February 14, 2026
raviranjan
February 14, 2026


/https%3A%2F%2F1.bp.blogspot.com%2F-VUIFbYja7x0%2FXle7PHrnBPI%2FAAAAAAAAE28%2FB8nkBsVcXVoDRo6Xq294smloAhsvTJyGQCLcBGAsYHQ%2Fs1600%2F728x90.jpg)
/https%3A%2F%2F1.bp.blogspot.com%2F-5OHMqsbBDH8%2FXk2rDk4Fs0I%2FAAAAAAAAE18%2F-jI5GDCZGNsE9CfKDzsvNga06RVNcCCqACPcBGAYYCw%2Fs400%2Fphoto_2020-02-20_03-08-19.jpg)
/https%3A%2F%2F1.bp.blogspot.com%2F-ivxaUtrhkXM%2FXle8IXRBEaI%2FAAAAAAAAE3E%2F7wRVVICnHVUT-3Km1gTZB-MDAPpyJd2VQCLcBGAsYHQ%2Fs320%2F336x280.jpg)
/https%3A%2F%2F1.bp.blogspot.com%2F-VUIFbYja7x0%2FXle7PHrnBPI%2FAAAAAAAAE28%2Fq70d2vUsNFAsQsmuBeAlSGg8Y1Vh8W_FwCEwYBhgL%2Fs1600%2F728x90.jpg)
/https%3A%2F%2F1.bp.blogspot.com%2F-51QGVuTWHY0%2FXle56nqYQqI%2FAAAAAAAAE2s%2FBan5Dx-BDsElLMx4wbKkMNQ8o1C0ckaIACPcBGAYYCw%2Fs400%2Fskrill.png)

/https%3A%2F%2F1.bp.blogspot.com%2F-ez_z2GfPqys%2FXk2oCLTa7xI%2FAAAAAAAAE1s%2FG_e31mxVM9Qlv3Y8uFeTaqJC9QbM6TTsgCLcBGAsYHQ%2Fs200%2Fhand-click-apply-now-button-flat_115464-79.jpg)
/https%3A%2F%2F1.bp.blogspot.com%2F-xOtfvRT_-wM%2FXk2jCAjhHhI%2FAAAAAAAAE1k%2FGRVpF-zruTgdR3ZqcPHvjJ920F7m9bXgACEwYBhgL%2Fs640%2FScreenshot_2020-02-08-21-45-34.png)
/https%3A%2F%2F1.bp.blogspot.com%2F-0KufOl02e2s%2FXk2jCFZDoyI%2FAAAAAAAAE1k%2FK_VPXK2_DzEAhftpQUMMwyAMoJv1GrmfwCEwYBhgL%2Fs640%2Fphoto_2020-02-10_21-32-09.jpg)